SMS Marketing KPIs You Should Track: Open Rate, Click-Through, Conversion, Unsubscribe — What Each Means
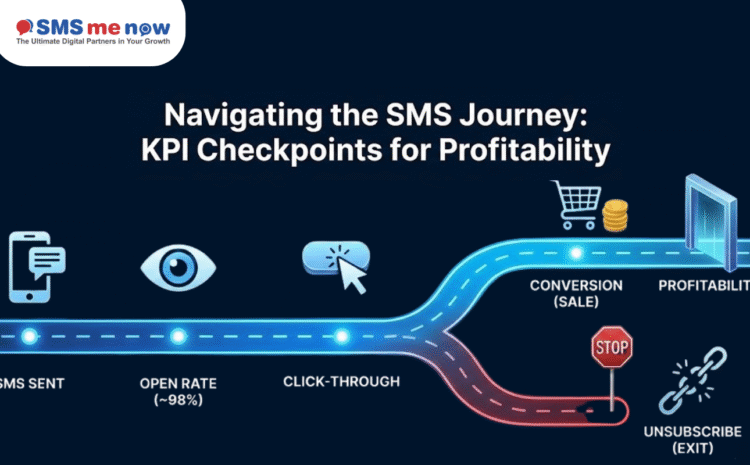
SMS Marketing KPIs You Should Track. SMS (Short Message Service) marketing is the powerhouse of immediate communication. With nearly 98% open rates and messages typically read within the first three minutes of receipt, it offers an urgency and directness no other channel can match.
However, success in SMS isn’t just about sending texts; it’s about understanding the Key Performance Indicators (KPIs) that measure the health and profitability of your campaigns. A high open rate is great, but if those opens don’t translate into sales, your strategy needs an overhaul.
For marketers looking to maximize mobile ROI, moving beyond vanity metrics and tracking the right KPIs is crucial. This comprehensive guide breaks down the most vital SMS marketing metrics—Open Rate, Click-Through Rate, Conversion Rate, and Unsubscribe Rate—explaining what each number tells you and how you can use that data to build hyper-effective, revenue-generating mobile campaigns.
The Foundation: Delivery Rate (The Gatekeeper)
Before any other metric matters, you must ensure your messages are reaching their intended recipients.
KPI: Delivery Rate
- What it is: The percentage of messages successfully delivered to the carrier and received by the customer’s device.
- Formula:
$$\text{Delivery Rate} = \frac{\text{Messages Delivered}}{\text{Messages Sent}} \times 100$$
- Benchmarks: Ideally, this should be 95% or higher.
- What it tells you: A low delivery rate indicates problems with your list health (old, inactive, or invalid numbers) or potential carrier filtering due to high spam complaints.
- Actionable Steps:
- List Cleaning: Regularly remove hard bounces and inactive numbers.
- Compliance: Ensure you adhere strictly to legal compliance and avoid sending unauthorized messages that lead to carrier blocking.
Open Rate (The Urgency Indicator)
While SMS open rates are inherently high, the way customers “open” or consume a text message is different from email.
KPI: Open Rate
- What it is: The percentage of delivered messages that the recipient views. (Note: Many platforms assume a text is “opened” upon successful delivery, given the immediacy of mobile notifications.)
- Benchmarks: Generally 90% – 99%.
- What it tells you:
- High Rate: Confirms the channel’s strength—your message is getting through and being read immediately.
- Subtle Drop: Can signal “message fatigue.” If your rate dips below 95%, your audience might be getting tired of your notifications and skimming them without absorbing the content.
- Actionable Steps:
- Segmentation: Avoid sending generic messages. Segment your lists to ensure the content is always relevant.
- Content Relevance: Only send messages with high perceived value (urgency, exclusive codes, critical updates).
Click-Through Rate (CTR) (The Engagement Metric)
The CTR is the first genuine measure of your message’s effectiveness and its ability to engage the customer.
KPI: Click-Through Rate (CTR)
- What it is: The percentage of people who clicked the link contained within the text message.
- Formula:
$$\text{CTR} = \frac{\text{Unique Clicks}}{\text{Messages Delivered}} \times 100$$
- Benchmarks: A good SMS CTR is typically 15% – 30% (significantly higher than email).
- What it tells you:
- Message Quality: A high CTR means your copy is concise, compelling, and the offer is strong enough to interrupt the recipient’s day.
- CTA Strength: It measures the effectiveness of your Call-to-Action (CTA) and the accompanying link.
- Actionable Steps:
- Strong, Clear CTA: Use verbs and create urgency (e.g., “Shop Now,” “Claim Your Deal,” “Join Today”).
- URL Shortening: Use short, branded URLs (tracked via your platform) to save character space and improve tracking accuracy.
- A/B Testing: Test different CTAs, urgency triggers (e.g., time limits vs. limited stock), and opening lines.
Conversion Rate (The Revenue Metric)
The Conversion Rate is where marketing meets profit. It’s the ultimate measure of ROI.
KPI: Conversion Rate
- What it is: The percentage of recipients who clicked the link in your SMS and then completed the desired action (e.g., purchase, sign-up, download, booking).
- Formula:
$$\text{Conversion Rate} = \frac{\text{Conversions}}{\text{Messages Delivered}} \times 100$$
- Benchmarks: Highly dependent on the industry and offer, but aiming for 5% – 15% for promotional campaigns is a strong target.
- What it tells you:
- Offer/Product Fit: Low conversion rates often signal that while the message copy was good (high CTR), the offer was poor or the landing page was confusing.
- Friction: Measures the smoothness of your post-click journey.
- Actionable Steps:
- Landing Page Optimization: Ensure the landing page is 100% mobile-friendly, loads quickly, and is consistent with the SMS offer (don’t make them search for the product or code).
- Checkout Friction: Minimize steps in the checkout process. Use one-click checkout options if possible.
- Attribution: Ensure your tracking platform correctly attributes the final sale back to the specific SMS campaign link.
Unsubscribe Rate (The Health Metric)
The Unsubscribe Rate is a crucial indicator of list health and message frequency/relevance.
KPI: Unsubscribe Rate
- What it is: The percentage of recipients who opted out of your SMS list after receiving a specific message.
- Formula:
$$\text{Unsubscribe Rate} = \frac{\text{Opt-outs}}{\text{Messages Delivered}} \times 100$$
- Benchmarks: This should ideally remain below 0.5% (industry best practice is often below 0.2%).
- What it tells you:
- High Rate: Signals major problems, usually message frequency (you’re sending too often) or content irrelevance (you’re sending generic messages to highly segmented users).
- Message Fatigue: A sudden spike after a promotional campaign shows the offer wasn’t worth the interruption.
- Actionable Steps:
- Reduce Frequency: Analyze your sending calendar. If you send 10 messages a month, test reducing it to 5.
- Refine Segmentation: Allow users to opt-down (e.g., “Reply PROMO to stop sales alerts, but keep receiving order updates”).
- Timing: Stop sending messages outside of acceptable hours (early morning/late night in the recipient’s time zone).
Calculating the Ultimate ROI: Revenue per Message
The only true measure of marketing success is profitability. The Revenue per Message (RPM) metric ties all the above KPIs together into a single dollar value.
KPI: Revenue Per Message (RPM)
- What it is: The average revenue generated for every single message sent.
- Formula:
$$\text{RPM} = \frac{\text{Total Revenue Generated}}{\text{Messages Sent}}$$
- What it tells you: This allows you to directly compare the profitability of different campaigns (e.g., “Abandoned Cart” SMS vs. “Flash Sale” SMS). It also helps justify your SMS platform costs.
- The Goal: Optimize all other metrics (CTR, Conversion) to drive up your RPM. If one campaign has a high CTR but low conversion, it will have a low RPM, telling you to fix the landing page.
Strategic Optimization: Turning Data into Action
| Low Metric | The Problem It Indicates | The Solution (Focus Area) |
| Low Delivery Rate | Invalid numbers, carrier filtering. | List Health: Aggressive list cleaning and strict opt-in compliance. |
| Low CTR | Weak copy, non-urgent offer, poor CTA. | Message Copy: A/B test CTAs, inject powerful urgency/scarcity. |
| Low Conversion Rate | Friction, unconvincing landing page. | Landing Page: Optimize page speed, ensure mobile-friendliness, align offer copy exactly. |
| High Unsubscribe Rate | Message fatigue, irrelevant content. | Frequency & Segmentation: Reduce sending volume; allow customers to choose message types. |
Launch Your High-ROI SMS Campaigns with Us!
Understanding these KPIs is the difference between simply using SMS and mastering mobile marketing. To truly maximize ROI, you need a platform that not only tracks these metrics accurately but also provides the automation and segmentation tools necessary to act on the data.
Our platform provides:
- ✅ Real-Time Attribution: Track every click and conversion directly back to the originating SMS link, giving you perfect RPM data.
- ✅ Automated Segmentation: Easily create segments based on behavior (e.g., “High CTR, Low Conversion” users) for hyper-targeted follow-up.
- ✅ Compliance Tools: Built-in features to manage opt-ins, opt-outs, and time-zone rules, keeping your delivery and unsubscribe rates healthy.
Stop guessing at your mobile performance. Start generating measurable, maximum revenue.
Frequently Asked Questions (FAQ)
Q1: Why is SMS CTR so much higher than email CTR?
A: SMS is highly direct and personal. There is no spam folder or algorithm filter, and messages demand immediate attention, leading to a much higher click propensity if the offer is valuable.
Q2: If my open rate is 95%, is there any room for improvement?
A: No, not really. Instead of focusing on the Open Rate, shift your focus to the CTR and Conversion Rate. An open text that isn’t clicked or converted is a missed opportunity.
Q3: What is a good benchmark for Revenue Per Message (RPM)?
A: This varies widely, but a well-optimized promotional campaign should aim for an RPM that is at least 5 to 10 times the cost of sending the message (e.g., if a message costs $0.05, aim for $0.25 to $0.50 RPM).
Q4: How do I track conversions from SMS accurately?
A: You must use unique, trackable UTM parameters or shortlinks generated by your SMS platform for every campaign link. These parameters allow your analytics (Google Analytics, CRM) to attribute the final conversion correctly.
Q5: Is it better to send fewer messages with better results or more messages with average results?
A: Fewer messages with better results are always preferred. Excessive frequency leads to message fatigue and a high Unsubscribe Rate, which permanently shrinks your most valuable communication channel.
Q6: Should I include a discount code in every SMS?
A: No. If you only send discounts, you devalue the channel. Mix promotional texts with high-value content like new product drops, early access, and critical service/delivery updates.
Q7: How can I reduce my Unsubscribe Rate?
A: Lower your overall sending frequency, segment your audience more strictly based on interest/behavior, and ensure you always include the mandatory “Reply STOP” opt-out message.
Q8: What is the risk of having a low Delivery Rate?
A: A sustained low Delivery Rate signals poor list hygiene, which can lead to your sender number being flagged by mobile carriers as spam, potentially blocking all future messages.
Disclaimer
The KPI benchmarks and formulas provided in this guide are based on industry averages and best practices for direct-to-consumer SMS marketing. Actual campaign results, CTRs, and conversion rates will fluctuate based on your specific industry, customer list size, message frequency, offer appeal, and the quality of your website landing pages. Continuous monitoring and A/B testing are essential for achieving and maintaining high performance.